Uncertainty Quantification in System Identification for Rapid SHM Applications
Sponsors / Collaborators: Air Force Research Laboratory, Army Research Laboratory
Spectral analysis spans a wide class of methodologies used in system identification, which is a required part of structural health monitoring (SHM). Benefiting from the clear physical relationships between frequency responses and structural parameters, “change of spectra” often contains, more or less, information of the occurrence, type, severity, and location of structural damage. Compared to traditional spectra such as power density and input-output transfer function, transmissibility, which can be regarded as output-output transfer function, has been shown to be more sensitive to local structural parameter changes, and therefore a better indicator for damages.
In real applications, spectral estimations always contain uncertainty from various sources, including operational variability, environmental fluctuation, measurement noise, and computational algorithm approximation. These uncertainties compromise power spectra estimates and may lead to significant amount of false positive damage indications in the interpretation of data, regardless of specific application.
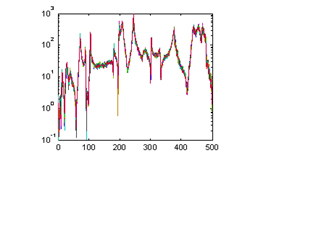
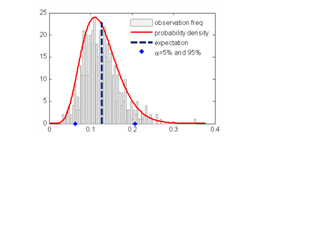
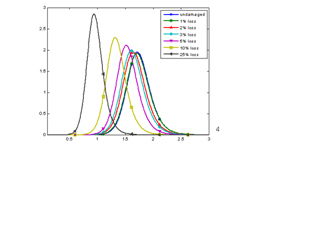
Our research has focused on the uncertainty quantification of different spectral estimations and statistically modeled the actual distribution for those spectra, including auto-power density function, input-output transfer function and particularly transmissibility. We have successfully established analytically the probability density function of magnitude and phase estimations for some of the key spectra for SHM application. Figure (1) and (2) show an example of noisy estimation and its uncertainty quantification, expressed with probability density function. Based on the modeling, we quantitatively know how the estimations are separated/overlapped for different damage cases, especially valuable for small damages, as shown in Figure (3). For most of the realistic conditions, damaged observations are not totally separated from baseline distributions, therefore, under an arbitrary threshold, there would be both type-I (false-positive) and type-II (false-negative) errors existed which make it hard for binary decision-making.
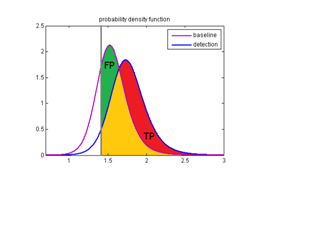
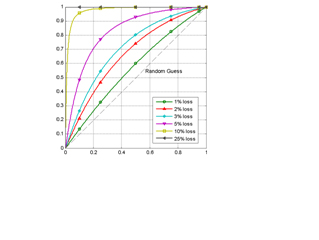
Therefore, besides research on the uncertainty quantification itself, we also focus on the application of these models, especially for the improvement of decision-making with quantified uncertainty. Figure (4) illustrates the definition of false-positive and true-positive rate, which are the integration over the corresponding domains. Figure (5) plots true positive rate vs. false positive rate, namely, receiver operating characteristic curves for different level of damages. The cluster of curves is very useful for binary classification test, which graphically delivers information guiding the trade-off to get both optimal sensitivity and specificity.

